
Search for Indicators
CDC PLACES
The PLACES Project is a collaboration between CDC, the Robert Wood Johnson Foundation (RWJF), and the CDC Foundation (CDCF). PLACES will allow counties, places, and local health departments regardless of population size and urban-rural status to better understand the burden and geographic distribution of health-related outcomes in their jurisdictions and assist them in planning public health interventions.
PLACES is an extension of the original 500 Cities Project that provided city and census tract estimates for chronic disease risk factors, health outcomes, and clinical preventive services use for the 500 largest US cities. The PLACES Project provides model-based population-level analysis and community estimates to all counties, places (incorporated and census designated places), census tracts, and ZIP Code Tabulation Areas (ZCTAs) across the United States. See a Notice to Data Users and learn more about the PLACES Project.
Use the drop-down menu below to see data at different locales.
Indicator Gauge Icon Legend
Legend Colors
Red is bad, green is good, blue is not statistically different/neutral.
Compared to Distribution
 the value is in the best half of communities.
 the value is in the 2nd worst quarter of communities.
 the value is in the worst quarter of communities.
Compared to Target
 meets target;
  does not meet target.
Compared to a Single Value
 lower than the comparison value;
 higher than the comparison value;
 not statistically different from comparison value.
Trend

 non-significant change over time;
 significant change over time;
  no change over time.
Compared to Prior Value
 higher than the previous measurement period;
 lower than the previous measurement period;
 no statistically different change from previous measurement period.
Census Place (City): Savannah
Health / Alcohol & Drug Use
Value
Compared to:
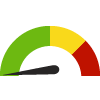
Census Place (City): Savannah Adults who Binge Drink
Census Place (City): Savannah Adults who Binge Drink
14.9%
(2021)
Compared to:

GA Census Places
The distribution is based on data from 620 locales.
U.S. Census Places
The distribution is based on data from 27,528 U.S. Census Places.
Chatham, GA County Value
(14.8%)
The regional value is compared to the Chatham County value.
US Value
(15.5%)
The regional value is compared to the national value.
Census Place (City): Savannah
Health / Cancer
Value
Compared to:
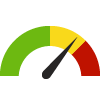
Census Place (City): Savannah Adults with Cancer
Census Place (City): Savannah Adults with Cancer
5.3%
(2021)
Compared to:
GA Census Places
The distribution is based on data from 620 locales.
U.S. Census Places
The distribution is based on data from 27,528 U.S. Census Places.
Chatham, GA County Value
(6.4%)
The regional value is compared to the Chatham County value.
US Value
(7.0%)
The regional value is compared to the national value.
Census Place (City): Savannah Cervical Cancer Screening: 21-65
Census Place (City): Savannah Cervical Cancer Screening: 21-65
80.2%
(2020)
Compared to:

GA Census Places
The distribution is based on data from 620 locales.
U.S. Census Places
The distribution is based on data from 28,438 U.S. Census Places.
Chatham, GA County Value
(82.9%)
The regional value is compared to the Chatham County value.
US Value
(82.8%)
The regional value is compared to the national value.
Census Place (City): Savannah Colon Cancer Screening
Census Place (City): Savannah Colon Cancer Screening
64.5%
(2018)
Compared to:
GA Census Places
The distribution is based on data from 620 locales.
U.S. Census Places
The distribution is based on data from 28,435 U.S. Census Places.
Chatham, GA County Value
(68.2%)
The regional value is compared to the Chatham County value.
US Value
(66.4%)
The regional value is compared to the national value.
Census Place (City): Savannah Colon Cancer Screening: USPSTF Recommendation
Census Place (City): Savannah Colon Cancer Screening: USPSTF Recommendation
74.3%
(2020)
Compared to:
GA Census Places
The distribution is based on data from 620 locales.
U.S. Census Places
The distribution is based on data from 28,435 U.S. Census Places.
Chatham, GA County Value
(77.2%)
The regional value is compared to the Chatham County value.
US Value
(72.4%)
The regional value is compared to the national value.
Census Place (City): Savannah Mammogram in Past 2 Years: 50-74
Census Place (City): Savannah Mammogram in Past 2 Years: 50-74
81.7%
(2020)
Compared to:
GA Census Places
The distribution is based on data from 620 locales.
U.S. Census Places
The distribution is based on data from 28,432 U.S. Census Places.
Chatham, GA County Value
(77.6%)
The regional value is compared to the Chatham County value.
US Value
(78.2%)
The regional value is compared to the national value.
HP 2030 Target
(80.3%)
Census Place (City): Savannah Pap Test in Past 3 Years: 21-65
Census Place (City): Savannah Pap Test in Past 3 Years: 21-65
83.7%
(2016)
Compared to:
US Value
(79.5%)
The regional value is compared to the national value.
Census Place (City): Savannah
Health / Diabetes
Value
Compared to:
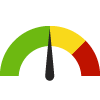
Census Place (City): Savannah Adults with Diabetes
Census Place (City): Savannah Adults with Diabetes
13.3%
(2021)
Compared to:
GA Census Places
The distribution is based on data from 620 locales.
U.S. Census Places
The distribution is based on data from 27,528 U.S. Census Places.
US Value
(11.3%)
The regional value is compared to the national value.
Census Place (City): Savannah
Health / Health Care Access & Quality
Value
Compared to:
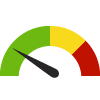
Census Place (City): Savannah Adults who have had a Routine Checkup
Census Place (City): Savannah Adults who have had a Routine Checkup
77.0%
(2021)
Compared to:
GA Census Places
The distribution is based on data from 620 locales.
U.S. Census Places
The distribution is based on data from 27,528 U.S. Census Places.
Chatham, GA County Value
(77.7%)
The regional value is compared to the Chatham County value.
US Value
(73.6%)
The regional value is compared to the national value.
Census Place (City): Savannah Adults without Health Insurance
Census Place (City): Savannah Adults without Health Insurance
17.6%
(2021)
Compared to:
GA Census Places
The distribution is based on data from 620 locales.
U.S. Census Places
The distribution is based on data from 27,528 U.S. Census Places.
Chatham, GA County Value
(14.7%)
The regional value is compared to the Chatham County value.
US Value
(10.8%)
The regional value is compared to the national value.
Census Place (City): Savannah
Health / Heart Disease & Stroke
Value
Compared to:
Census Place (City): Savannah Adults who Experienced a Stroke
Census Place (City): Savannah Adults who Experienced a Stroke
3.7%
(2021)
Compared to:
GA Census Places
The distribution is based on data from 620 locales.
U.S. Census Places
The distribution is based on data from 27,528 U.S. Census Places.
Chatham, GA County Value
(3.4%)
The regional value is compared to the Chatham County value.
US Value
(3.3%)
The regional value is compared to the national value.
Census Place (City): Savannah Adults who Experienced Coronary Heart Disease
Census Place (City): Savannah Adults who Experienced Coronary Heart Disease
5.5%
(2021)
Compared to:
GA Census Places
The distribution is based on data from 620 locales.
U.S. Census Places
The distribution is based on data from 27,528 U.S. Census Places.
Chatham, GA County Value
(5.8%)
The regional value is compared to the Chatham County value.
US Value
(6.1%)
The regional value is compared to the national value.
Census Place (City): Savannah Adults who Have Taken Medications for High Blood Pressure
Census Place (City): Savannah Adults who Have Taken Medications for High Blood Pressure
76.2%
(2021)
Compared to:
GA Census Places
The distribution is based on data from 620 locales.
U.S. Census Places
The distribution is based on data from 27,528 U.S. Census Places.
Chatham, GA County Value
(78.1%)
The regional value is compared to the Chatham County value.
US Value
(78.2%)
The regional value is compared to the national value.
Census Place (City): Savannah Cholesterol Test History
Census Place (City): Savannah Cholesterol Test History
83.1%
(2021)
Compared to:
GA Census Places
The distribution is based on data from 620 locales.
U.S. Census Places
The distribution is based on data from 27,528 U.S. Census Places.
Chatham, GA County Value
(86.8%)
The regional value is compared to the Chatham County value.
US Value
(86.4%)
The regional value is compared to the national value.
Census Place (City): Savannah High Blood Pressure Prevalence
Census Place (City): Savannah High Blood Pressure Prevalence
37.0%
(2021)
Compared to:
GA Census Places
The distribution is based on data from 620 locales.
U.S. Census Places
The distribution is based on data from 27,528 U.S. Census Places.
Chatham, GA County Value
(37.1%)
The regional value is compared to the Chatham County value.
US Value
(32.7%)
The regional value is compared to the national value.
HP 2030 Target
(41.9%)
Census Place (City): Savannah High Cholesterol Prevalence: Past 5 Years
Census Place (City): Savannah High Cholesterol Prevalence: Past 5 Years
34.5%
(2021)
Compared to:
GA Census Places
The distribution is based on data from 620 locales.
U.S. Census Places
The distribution is based on data from 27,528 U.S. Census Places.
Chatham, GA County Value
(37.2%)
The regional value is compared to the Chatham County value.
US Value
(36.4%)
The regional value is compared to the national value.
Census Place (City): Savannah
Health / Mental Health & Mental Disorders
Value
Compared to:
Census Place (City): Savannah Adults Ever Diagnosed with Depression
Census Place (City): Savannah Adults Ever Diagnosed with Depression
20.0%
(2021)
Compared to:
GA Census Places
The distribution is based on data from 620 locales.
U.S. Census Places
The distribution is based on data from 27,528 U.S. Census Places.
Chatham, GA County Value
(18.9%)
The regional value is compared to the Chatham County value.
US Value
(19.5%)
The regional value is compared to the national value.
Census Place (City): Savannah Poor Mental Health: 14+ Days
Census Place (City): Savannah Poor Mental Health: 14+ Days
18.5%
(2021)
Compared to:
GA Census Places
The distribution is based on data from 620 locales.
U.S. Census Places
The distribution is based on data from 27,528 U.S. Census Places.
Chatham, GA County Value
(15.6%)
The regional value is compared to the Chatham County value.
US Value
(14.7%)
The regional value is compared to the national value.
Census Place (City): Savannah
Health / Older Adults
Value
Compared to:
Census Place (City): Savannah Adults 65+ who Received Recommended Preventive Services: Females
Census Place (City): Savannah Adults 65+ who Received Recommended Preventive Services: Females
35.8%
(2020)
Compared to:
GA Census Places
The distribution is based on data from 620 locales.
U.S. Census Places
The distribution is based on data from 28,400 U.S. Census Places.
Chatham, GA County Value
(40.8%)
The regional value is compared to the Chatham County value.
US Value
(37.9%)
The regional value is compared to the national value.
Census Place (City): Savannah Adults 65+ who Received Recommended Preventive Services: Males
Census Place (City): Savannah Adults 65+ who Received Recommended Preventive Services: Males
47.4%
(2020)
Compared to:
GA Census Places
The distribution is based on data from 619 locales.
U.S. Census Places
The distribution is based on data from 28,400 U.S. Census Places.
Chatham, GA County Value
(51.5%)
The regional value is compared to the Chatham County value.
US Value
(43.7%)
The regional value is compared to the national value.
Census Place (City): Savannah
Health / Oral Health
Value
Compared to:
Census Place (City): Savannah Adults 65+ with Total Tooth Loss
Census Place (City): Savannah Adults 65+ with Total Tooth Loss
20.6%
(2020)
Compared to:
GA Census Places
The distribution is based on data from 620 locales.
U.S. Census Places
The distribution is based on data from 28,418 U.S. Census Places.
Chatham, GA County Value
(12.3%)
The regional value is compared to the Chatham County value.
US Value
(13.4%)
The regional value is compared to the national value.
Census Place (City): Savannah Adults who Visited a Dentist
Census Place (City): Savannah Adults who Visited a Dentist
57.5%
(2020)
Compared to:
GA Census Places
The distribution is based on data from 620 locales.
U.S. Census Places
The distribution is based on data from 28,438 U.S. Census Places.
Chatham, GA County Value
(63.3%)
The regional value is compared to the Chatham County value.
US Value
(64.8%)
The regional value is compared to the national value.
Census Place (City): Savannah
Health / Other Conditions
Value
Compared to:
Census Place (City): Savannah Adults with Arthritis
Census Place (City): Savannah Adults with Arthritis
22.6%
(2021)
Compared to:
GA Census Places
The distribution is based on data from 620 locales.
U.S. Census Places
The distribution is based on data from 27,528 U.S. Census Places.
Chatham, GA County Value
(24.2%)
The regional value is compared to the Chatham County value.
US Value
(25.2%)
The regional value is compared to the national value.
Census Place (City): Savannah Adults with Kidney Disease
Census Place (City): Savannah Adults with Kidney Disease
3.4%
(2021)
Compared to:
GA Census Places
The distribution is based on data from 620 locales.
U.S. Census Places
The distribution is based on data from 27,528 U.S. Census Places.
Chatham, GA County Value
(3.4%)
The regional value is compared to the Chatham County value.
US Value
(3.1%)
The regional value is compared to the national value.
Census Place (City): Savannah
Health / Physical Activity
Value
Compared to:
Census Place (City): Savannah Adults who are Sedentary
Census Place (City): Savannah Adults who are Sedentary
29.1%
(2021)
Compared to:
GA Census Places
The distribution is based on data from 620 locales.
U.S. Census Places
The distribution is based on data from 27,528 U.S. Census Places.
US Value
(23.7%)
The regional value is compared to the national value.
HP 2030 Target
(21.8%)
Census Place (City): Savannah
Health / Respiratory Diseases
Value
Compared to:
Census Place (City): Savannah Adults with COPD
Census Place (City): Savannah Adults with COPD
6.7%
Percent of adults
(2021)
Compared to:
GA Census Places
The distribution is based on data from 620 locales.
U.S. Census Places
The distribution is based on data from 27,528 U.S. Census Places.
Chatham, GA County Value
(6.3%)
The regional value is compared to the Chatham County value.
US Value
(6.4%)
The regional value is compared to the national value.
Census Place (City): Savannah Adults with Current Asthma
Census Place (City): Savannah Adults with Current Asthma
10.9%
(2021)
Compared to:
GA Census Places
The distribution is based on data from 620 locales.
U.S. Census Places
The distribution is based on data from 27,528 U.S. Census Places.
Chatham, GA County Value
(9.9%)
The regional value is compared to the Chatham County value.
US Value
(9.7%)
The regional value is compared to the national value.
Census Place (City): Savannah
Health / Tobacco Use
Value
Compared to:
Census Place (City): Savannah Adults who Smoke
Census Place (City): Savannah Adults who Smoke
18.4%
(2021)
Compared to:
GA Census Places
The distribution is based on data from 620 locales.
U.S. Census Places
The distribution is based on data from 27,528 U.S. Census Places.
Chatham, GA County Value
(15.6%)
The regional value is compared to the Chatham County value.
US Value
(13.5%)
The regional value is compared to the national value.
HP 2030 Target
(6.1%)
<div>TU-02: Reduce current cigarette smoking in adults <strong>(LEADING HEALTH INDICATOR)</strong></div>
Census Place (City): Savannah
Health / Weight Status
Value
Compared to:
Census Place (City): Savannah Adults Who Are Obese
Census Place (City): Savannah Adults Who Are Obese
35.2%
(2021)
Compared to:
GA Census Places
The distribution is based on data from 620 locales.
U.S. Census Places
The distribution is based on data from 27,528 U.S. Census Places.
US Value
(33.0%)
The regional value is compared to the national value.
Census Place (City): Savannah
Health / Wellness & Lifestyle
Value
Compared to:
Census Place (City): Savannah Insufficient Sleep
Census Place (City): Savannah Insufficient Sleep
39.7%
(2020)
Compared to:
GA Census Places
The distribution is based on data from 620 locales.
U.S. Census Places
The distribution is based on data from 28,438 U.S. Census Places.
Chatham, GA County Value
(36.7%)
The regional value is compared to the Chatham County value.
US Value
(32.7%)
The regional value is compared to the national value.
HP 2030 Target
(26.7%)
Census Place (City): Savannah Poor Physical Health: 14+ Days
Census Place (City): Savannah Poor Physical Health: 14+ Days
12.7%
(2021)
Compared to:
GA Census Places
The distribution is based on data from 620 locales.
U.S. Census Places
The distribution is based on data from 27,528 U.S. Census Places.
Chatham, GA County Value
(11.5%)
The regional value is compared to the Chatham County value.
US Value
(10.9%)
The regional value is compared to the national value.
Census Place (City): Savannah Self-Reported General Health Assessment: Poor or Fair
Census Place (City): Savannah Self-Reported General Health Assessment: Poor or Fair
20.5%
(2021)
Compared to:
GA Census Places
The distribution is based on data from 620 locales.
U.S. Census Places
The distribution is based on data from 27,528 U.S. Census Places.
Chatham, GA County Value
(17.2%)
The regional value is compared to the Chatham County value.
US Value
(16.1%)
The regional value is compared to the national value.
