
Search for Indicators

Priority: Education
2035 Vision
From early childhood education through post-secondary achievement, Chatham County’s innovative and inclusive educational systems are a model of academic excellence that enable students to have the knowledge, skills and ability to succeed at their chosen pathways.
Find out when our next project team meeting is by clicking here!
Priority Area Dashboard
Select a location to learn about your community's health and wellness. Compare indicators for your community against state averages, county values, and target goals. Discover areas of excellence and improvement in your community. Click each indicator to discover trend values, maps, and downloads.
Indicator Gauge Icon Legend
Legend Colors
Red is bad, green is good, blue is not statistically different/neutral.
Compared to Distribution
 the value is in the best half of communities.
 the value is in the 2nd worst quarter of communities.
 the value is in the worst quarter of communities.
Compared to Target
 meets target;
  does not meet target.
Compared to a Single Value
 lower than the comparison value;
 higher than the comparison value;
 not statistically different from comparison value.
Trend

 non-significant change over time;
 significant change over time;
  no change over time.
Compared to Prior Value
 higher than the previous measurement period;
 lower than the previous measurement period;
 no statistically different change from previous measurement period.
County: Chatham
Value
Compared to:
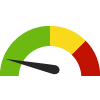
County: Chatham Student-to-Teacher Ratio
County: Chatham Student-to-Teacher Ratio
13.9
Students per teacher
(2022-2023)
Compared to:

GA Counties
The distribution is based on data from 159 Georgia counties.
U.S. Counties
The distribution is based on data from 3,125 U.S. counties and county equivalents.
GA Value
(14.4)
The regional value is compared to the Georgia State value.
US Value
(15.4)
The regional value is compared to the national value.
Prior Value
(13.4)
Prior Value compares a measured value with the previously measured value. Confidence intervals were not taken into account in determining the direction of the comparison.
Trend
This comparison measures the indicator’s values over multiple time periods.<br>The Mann-Kendall Test for Statistical Significance is used to evaluate the trend<br>over 4 to 10 periods of measure, subject to data availability and comparability.
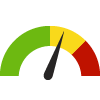
County: Chatham 2nd Grade Students Reading on or Above Grade Level
County: Chatham 2nd Grade Students Reading on or Above Grade Level
28.0%
(2018-2019 School Year)
Compared to:
Prior Value
(21.0%)
Prior Value compares a measured value with the previously measured value. Confidence intervals were not taken into account in determining the direction of the comparison.
2020 Blueprint Goal
(85%)
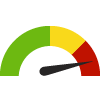
County: Chatham 4th Grade Students Reading on or Above Grade Level
County: Chatham 4th Grade Students Reading on or Above Grade Level
24.0%
(2018-2019 School Year)
Compared to:


Prior Value
(48.0%)
Prior Value compares a measured value with the previously measured value. Confidence intervals were not taken into account in determining the direction of the comparison.
Trend
This comparison measures the indicator’s values over multiple time periods.<br>The Mann-Kendall Test for Statistical Significance is used to evaluate the trend<br>over 4 to 10 periods of measure, subject to data availability and comparability.
2020 Blueprint Goal
(83%)
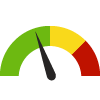
County: Chatham 7th Grade Students Reading on or Above Grade Level
County: Chatham 7th Grade Students Reading on or Above Grade Level
34.0%
(2018-2019 School Year)
Compared to:
Prior Value
(50.0%)
Prior Value compares a measured value with the previously measured value. Confidence intervals were not taken into account in determining the direction of the comparison.
Trend
This comparison measures the indicator’s values over multiple time periods.<br>The Mann-Kendall Test for Statistical Significance is used to evaluate the trend<br>over 4 to 10 periods of measure, subject to data availability and comparability.
2020 Blueprint Goal
(82%)
County: Chatham 6th-12th Grade Students Referred for School Discipline
County: Chatham 6th-12th Grade Students Referred for School Discipline
9.7%
(2018-2019 School Year)
Compared to:
Prior Value
(10.1%)
Prior Value compares a measured value with the previously measured value. Confidence intervals were not taken into account in determining the direction of the comparison.
Trend
This comparison measures the indicator’s values over multiple time periods.<br>The Mann-Kendall Test for Statistical Significance is used to evaluate the trend<br>over 4 to 10 periods of measure, subject to data availability and comparability.
2020 Blueprint Goal
(11.5%)
County: Chatham Parent and Community Engagement in Schools
County: Chatham Parent and Community Engagement in Schools
40.0
Points of Progress
(2018-2019 School Year)
Compared to:
Prior Value
(39.0)
Prior Value compares a measured value with the previously measured value. Confidence intervals were not taken into account in determining the direction of the comparison.
Trend
This comparison measures the indicator’s values over multiple time periods.<br>The Mann-Kendall Test for Statistical Significance is used to evaluate the trend<br>over 4 to 10 periods of measure, subject to data availability and comparability.
2020 Blueprint Goal
(30)
