
Search for Indicators

Priority: Health
2035 Vision
Chatham County has a culture of health including equal access to quality and affordable healthcare, chronic disease prevention, health inclusive policies and environmental design.
Find out when our next project team meeting is by clicking here!
Priority Area Dashboard
Select a location to learn about your community's health and wellness. Compare indicators for your community against state averages, county values, and target goals. Discover areas of excellence and improvement in your community. Click each indicator to discover trend values, maps, and downloads.
Indicator Gauge Icon Legend
Legend Colors
Red is bad, green is good, blue is not statistically different/neutral.
Compared to Distribution
 the value is in the best half of communities.
 the value is in the 2nd worst quarter of communities.
 the value is in the worst quarter of communities.
Compared to Target
 meets target;
  does not meet target.
Compared to a Single Value
 lower than the comparison value;
 higher than the comparison value;
 not statistically different from comparison value.
Trend

 non-significant change over time;
 significant change over time;
  no change over time.
Compared to Prior Value
 higher than the previous measurement period;
 lower than the previous measurement period;
 no statistically different change from previous measurement period.
County: Chatham
Value
Compared to:
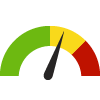
County: Chatham Frequent Mental Distress
County: Chatham Frequent Mental Distress
16.0%
(2019)
Compared to:


GA Counties
The distribution is based on data from 159 Georgia counties.
U.S. Counties
The distribution is based on data from 3,121 U.S. counties and county equivalents.
Charleston, SC County Value
(13.2%)
The regional value is compared to the Charleston County (SC) value.
Norfolk City, VA County Value
(15.2%)
The regional value is compared to the Norfolk City, VA county value.
Duval, FL County Value
(16.5%)
The regional value is compared to the Duval County (FL) value.
New Hanover, NC County Value
(14.5%)
The regional value is compared to the New Hanover County (NC) value.
GA Value
(15.5%)
The regional value is compared to the Georgia State value.
US Value
(14.0%)
The regional value is compared to the national value.
Prior Value
(13.3%)
Prior Value compares a measured value with the previously measured value. Confidence intervals were taken into account in determining the direction of the comparison.
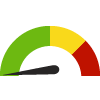
County: Chatham Access to Exercise Opportunities
County: Chatham Access to Exercise Opportunities
84.3%
(2024)
Compared to:


GA Counties
The distribution is based on data from 147 Georgia counties.
U.S. Counties
The distribution is based on data from 3,096 U.S. counties and county equivalents.
GA Value
(74.1%)
The regional value is compared to the Georgia State value.
US Value
(84.1%)
The regional value is compared to the national value.
Prior Value
(87.7%)
Prior Value compares a measured value with the previously measured value. Confidence intervals were not taken into account in determining the direction of the comparison.
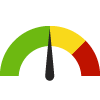
County: Chatham Food Insecurity Rate
County: Chatham Food Insecurity Rate
10.5%
(2021)
Compared to:
GA Counties
The distribution is based on data from 159 Georgia counties.
U.S. Counties
The distribution is based on data from 3,140 U.S. counties and county equivalents.
GA Value
(10.7%)
The regional value is compared to the Georgia State value.
US Value
(10.4%)
The regional value is compared to the national value.
Prior Value
(12.5%)
Prior Value compares a measured value with the previously measured value. Confidence intervals were not taken into account in determining the direction of the comparison.
Trend
This comparison measures the indicator’s values over multiple time periods.<br>The Mann-Kendall Test for Statistical Significance is used to evaluate the trend<br>over 4 to 10 periods of measure, subject to data availability and comparability.
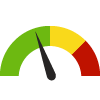
County: Chatham Adults with Health Insurance: 18-64
County: Chatham Adults with Health Insurance: 18-64
82.8%
(2021)
Compared to:
GA Counties
The distribution is based on data from 159 Georgia counties.
U.S. Counties
The distribution is based on data from 3,140 U.S. counties and county equivalents.
GA Value
(82.0%)
The regional value is compared to the Georgia State value.
Prior Value
(81.5%)
Prior Value compares a measured value with the previously measured value. Confidence intervals were taken into account in determining the direction of the comparison.
Trend
This comparison measures the indicator’s values over multiple time periods.<br>The Mann-Kendall Test for Statistical Significance is used to evaluate the trend<br>over 4 to 10 periods of measure, subject to data availability and comparability.
County: Chatham Children with Health Insurance
County: Chatham Children with Health Insurance
94.4%
(2021)
Compared to:
GA Counties
The distribution is based on data from 159 Georgia counties.
U.S. Counties
The distribution is based on data from 3,140 U.S. counties and county equivalents.
GA Value
(93.4%)
The regional value is compared to the Georgia State value.
Prior Value
(93.6%)
Prior Value compares a measured value with the previously measured value. Confidence intervals were taken into account in determining the direction of the comparison.
Trend
This comparison measures the indicator’s values over multiple time periods.<br>The Mann-Kendall Test for Statistical Significance is used to evaluate the trend<br>over 4 to 10 periods of measure, subject to data availability and comparability.
